CES alerts & population increases
- CES adults alerts – long term
- CES adults alerts – 25 years
- CES adults alerts – 10 years
- CES adults alerts – 5 years
- CES adults population increases of >50% – long term
| 1. Table of alerts for CES adults 1984-2020 |
| Species | Period (yrs) |
Plots (n) |
Change (%) |
Lower limit |
Upper limit |
Alert | Comment |
|---|---|---|---|---|---|---|---|
| Willow Tit | 36 | 15 | -82 | -93 | -60 | >50 | Small sample |
| Willow Warbler | 36 | 88 | -78 | -83 | -72 | >50 | |
| Greenfinch | 36 | 39 | -66 | -85 | -12 | >50 | |
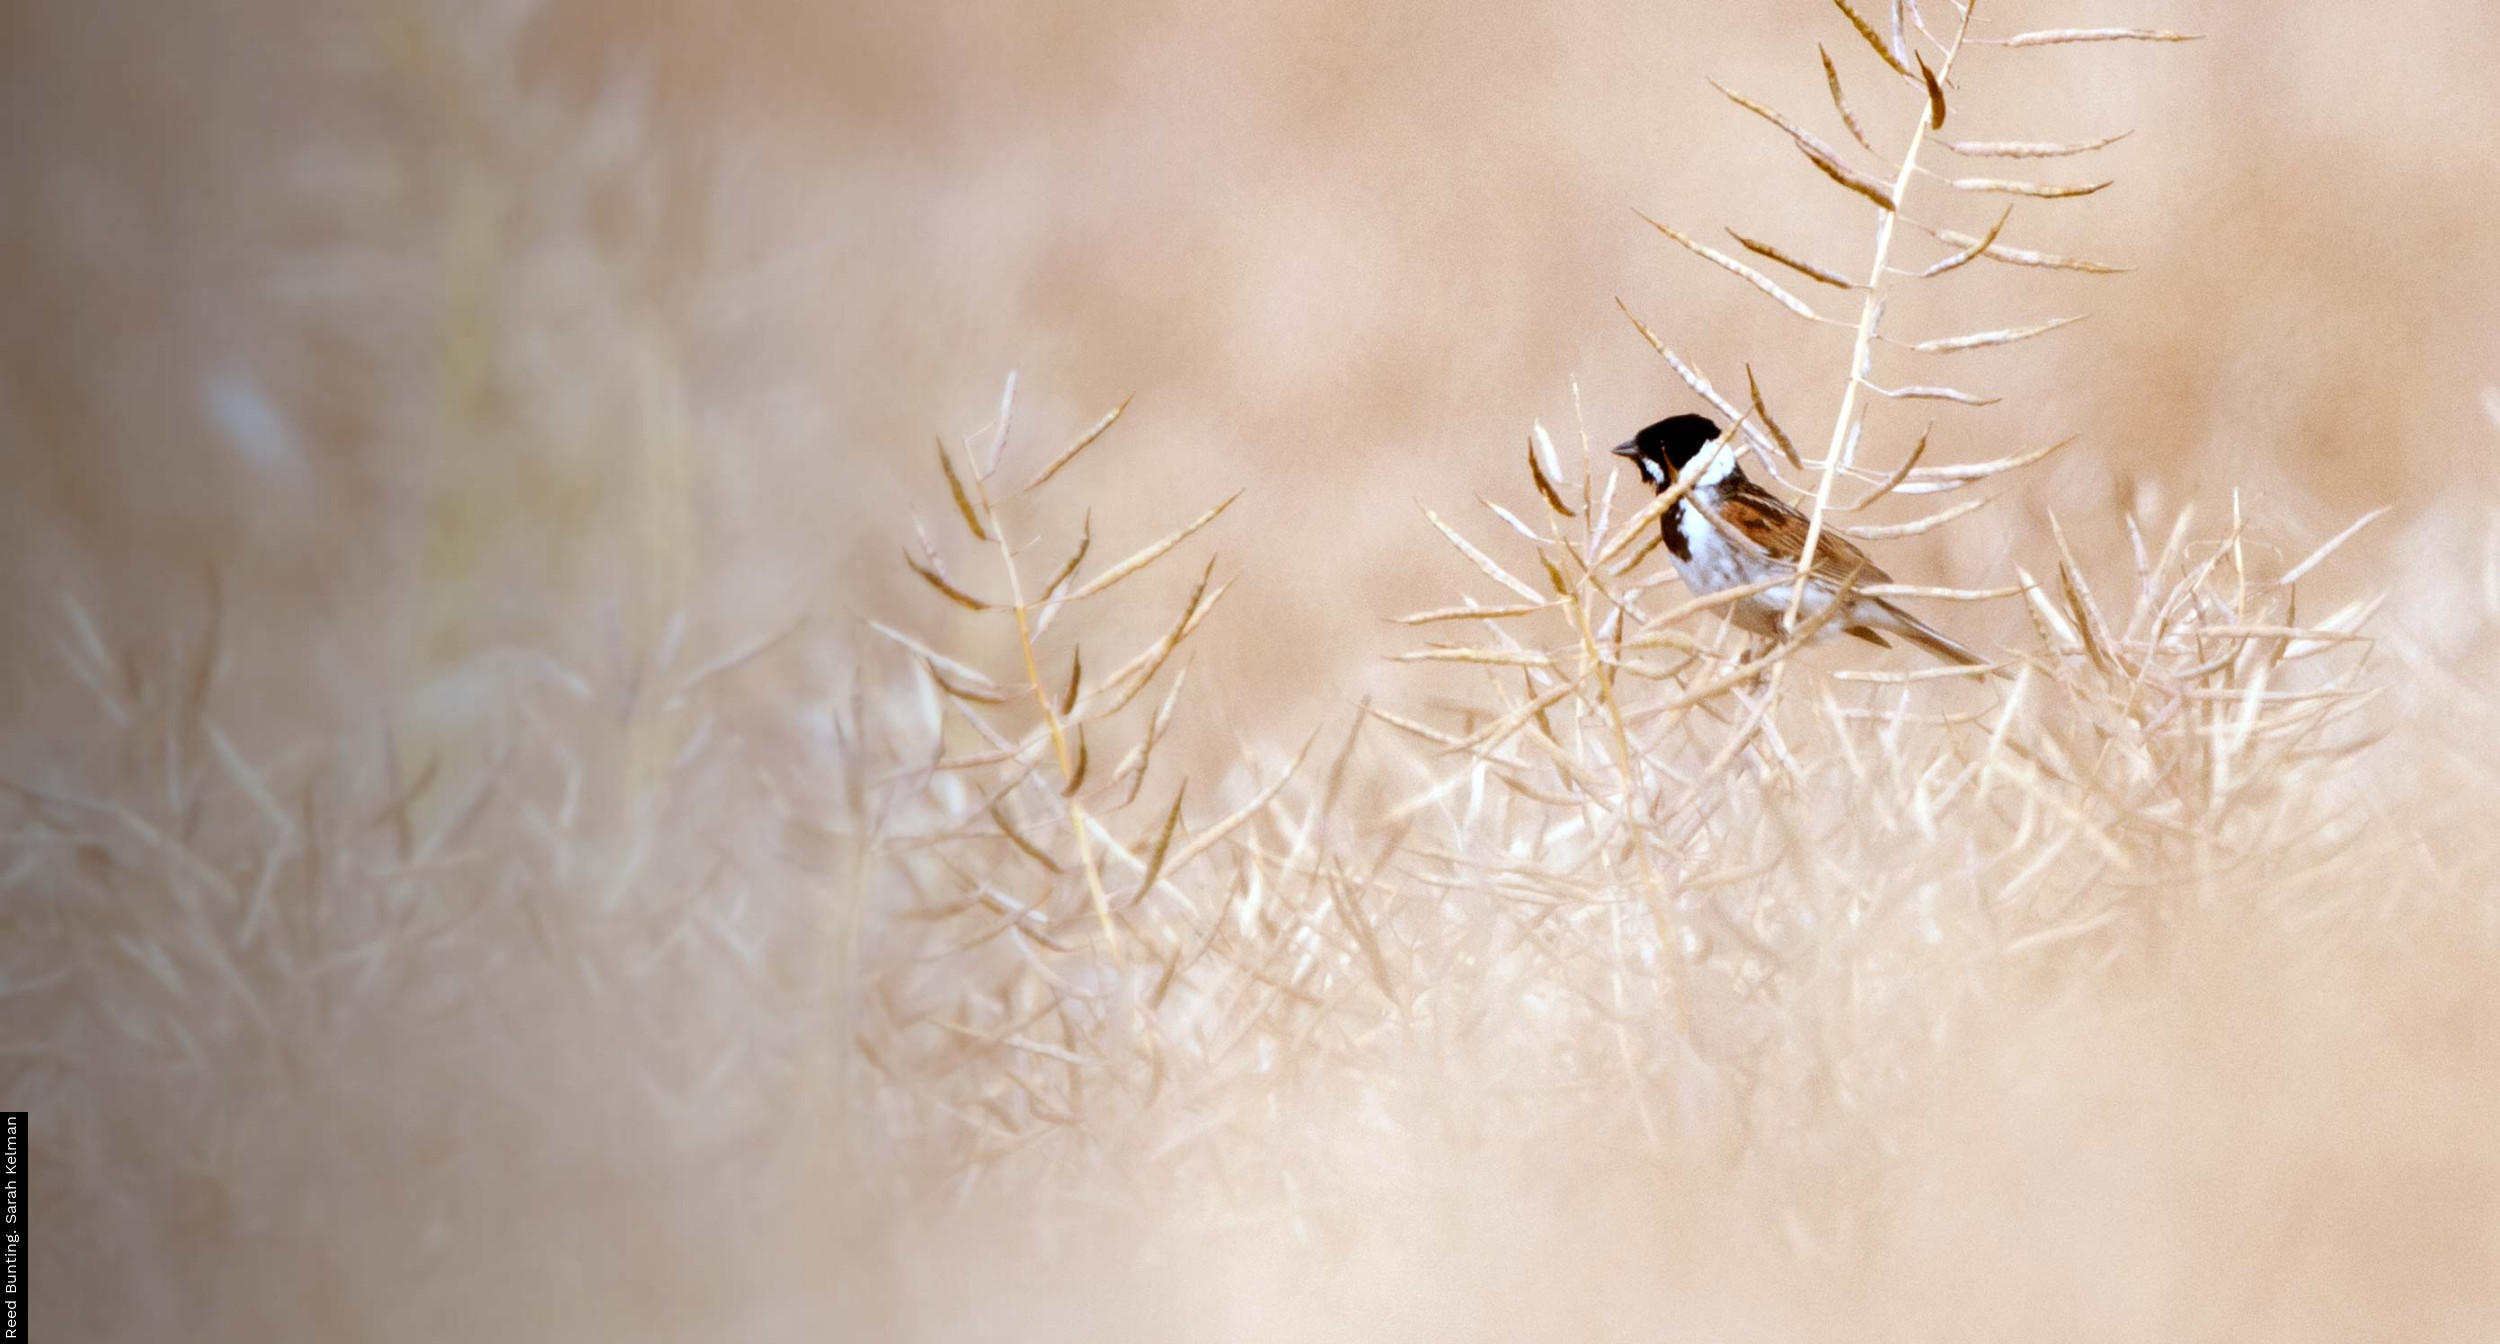
| Reed Bunting | 36 | 60 | -66 | -76 | -52 | >50 | |
| Chaffinch | 36 | 74 | -64 | -81 | -35 | >50 | |
| Lesser Whitethroat | 36 | 38 | -63 | -82 | -44 | >50 | |
| Sedge Warbler | 36 | 67 | -48 | -64 | -31 | >25 | |
| Whitethroat | 36 | 65 | -37 | -61 | -11 | >25 | |
| Reed Warbler | 36 | 59 | -28 | -44 | -3 | >25 |
| 2. Table of alerts for CES adults 1995-2020 |
| Species | Period (yrs) |
Plots (n) |
Change (%) |
Lower limit |
Upper limit |
Alert | Comment |
|---|---|---|---|---|---|---|---|
| Greenfinch | 25 | 42 | -84 | -90 | -73 | >50 | |
| Willow Tit | 25 | 12 | -77 | -92 | -44 | >50 | Small sample |
| Chaffinch | 25 | 79 | -75 | -82 | -69 | >50 | |
| Willow Warbler | 25 | 91 | -68 | -73 | -61 | >50 | |
| Lesser Whitethroat | 25 | 37 | -63 | -78 | -50 | >50 | |
| Sedge Warbler | 25 | 73 | -60 | -68 | -51 | >50 | |
| Reed Bunting | 25 | 66 | -52 | -61 | -36 | >50 | |
| Whitethroat | 25 | 72 | -43 | -58 | -25 | >25 | |
| Garden Warbler | 25 | 68 | -35 | -49 | -21 | >25 |
| 3. Table of alerts for CES adults 2010-2020 |
| Species | Period (yrs) |
Plots (n) |
Change (%) |
Lower limit |
Upper limit |
Alert | Comment |
|---|---|---|---|---|---|---|---|
| Greenfinch | 10 | 33 | -74 | -83 | -58 | >50 | |
| Chaffinch | 10 | 66 | -65 | -72 | -57 | >50 | |
| Willow Warbler | 10 | 85 | -35 | -43 | -26 | >25 |
| 4. Table of alerts for CES adults 2015-2020 |
| Species | Period (yrs) |
Plots (n) |
Change (%) |
Lower limit |
Upper limit |
Alert | Comment |
|---|---|---|---|---|---|---|---|
| Greenfinch | 5 | 30 | -56 | -69 | -38 | >50 | |
| Chaffinch | 5 | 57 | -54 | -62 | -46 | >50 |
| 5. Table of population increases for CES adults 1984-2020 |
| Species | Period (yrs) |
Plots (n) |
Change (%) |
Lower limit |
Upper limit |
Alert | Comment |
|---|---|---|---|---|---|---|---|
| Treecreeper | 36 | 38 | 77 | 11 | 191 | ||
| Wren | 36 | 102 | 83 | 54 | 123 | ||
| Goldfinch | 36 | 37 | 94 | 28 | 297 | ||
| Blackcap | 36 | 95 | 141 | 98 | 194 | ||
| Chiffchaff | 36 | 80 | 344 | 180 | 705 |
This report should be cited as: Massimino, D., Woodward, I.D., Hammond, M.J., Barber, L., Barimore, C., Harris, S.J., Leech, D.I., Noble, D.G., Walker, R.H., Baillie, S.R. & Robinson, R.A. (2020) BirdTrends 2020: trends in numbers, breeding success and survival for UK breeding birds. BTO Research Report 732. BTO, Thetford. www.bto.org/birdtrends


Share this page