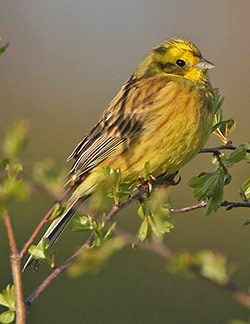
Focus on Yellowhammer
Yellowhammers are still busy breeding so now is a good time to go out and look for evidence of confirmed breeding for the Bird Atlas. The easiest way to confirm breeding is to look for adults with a beak full of insects which it will take to the nest (atlas breeding code = FF). You may also come across a family party with recently fledged young (atlas breeding code = FL).
Yellowhammers can have two, sometimes three, broods and can be actively breeding throughout August. So far we have confirmed breeding in 1311 10-km squares in Britain and 147 10-km squares in Ireland. There are over 800 10-km squares at the ‘possible’ or ‘probable’ level of breeding and these are the squares that we want to upgrade the breeding evidence. We can upgrade 'possible' to 'probable' by revisiting a site and looking for a pair of Yellowhammer (atlas breeding code = P) or recording territorial behaviour (atlas breeding code = T).
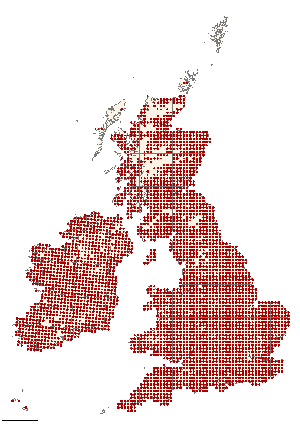
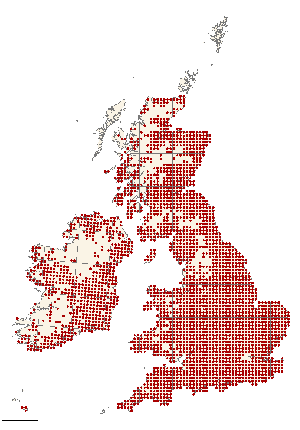
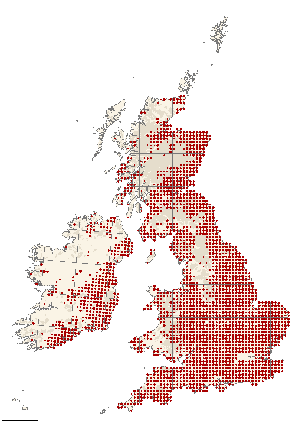
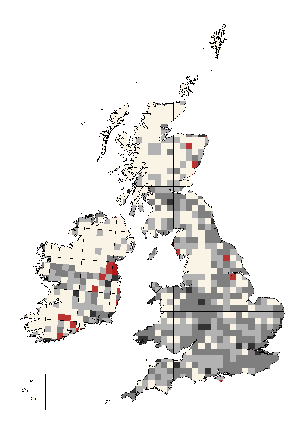
Looking at the maps from the breeding atlases in 1968-72, 1988-91 and the current work in 2008-11 we can see a steady contraction in range. Ireland has shown the greatest loss of occupied 10-km squares (63% loss of range between 1968-72 and 2008-11), mainly in the southwest and northwest of the country. It’s also interesting to see how the gaps that appeared in the 1988-91 map in Wales, along the Pennines, Greater London and southwest Scotland and in the Highlands have got bigger.
If we look at the Timed Tetrad Visit information (map on right) in more detail and look at the number of occupied tetrads (2x2km squares) within a 10-km square in the 1988-91 Atlas and the 2008-11 Atlas we can see that there are now fewer tetrads occupied than there used be (black and grey squares on the map) and only a small number of 10-km squares where there are now more tetrads occupied in the 10-km square (red squares). Information from the Common Birds Census and Breeding Birds Survey suggests a 56% decline in the UK between 1967 and 2008. In the Republic of Ireland the Countryside Bird Survey began monitoring in 1998 and has recorded a 0.67% decline in numbers between 1998 and 2009 suggesting a fairly stable population in recent years. However, we can see from the Atlas maps that there was a considerable loss of range, and therefore numbers, in the period before monitoring began.








Share this page