Methodology and survey design
Survey design
BBS survey squares are randomly selected from a list of all 1-km squares in the National Grid (covering the UK, Channel Islands and the Isle of Man). The use of volunteers is maximised through a stratified random sampling design. Initially, the number of squares allocated to each of the BTO’s regions (roughly counties) was a fixed proportion of the number of potential volunteers in the region, estimated using BTO membership information. For regions with relatively few potential volunteers, a minimum level of coverage was set. The difference in sampling effort is taken into account when calculating BBS trends.
Within each region, squares are selected randomly, and allocated to volunteers through a network of voluntary Regional Organisers (ROs). ROs are responsible for finding new volunteers and for allocating squares to observers in their region. The ROs and the BTO Wales and Ireland Officers provide invaluable support to the scheme, and we are very grateful for their assistance.
The aim of the survey is for as many of the same 1-km squares to be surveyed every year, in order to gather a run of comparable data from each square. Ideally, squares would be surveyed by the same person over the years, although in reality there is likely to be some changeover of volunteers.
If a square cannot be surveyed, e.g. if there is no possibility of gaining access permission to the land, or if the terrain is dangerous to cover, then it is deemed to be ‘uncoverable’, and is subsequently removed from the active list.
Field methodology
BBS fieldwork involves three visits to each survey square per year: a reconnaissance visit and two bird recording visits. During the reconnaissance visit, the transect routes are planned out and habitat information recorded. The ideal survey route comprises two parallel lines, each 1km in length, about 500m apart, and about 250m from the edge of the square. For practical reasons there is often substantial deviation from the ideal route, and for this reason, habitat data is collected periodically from both the ideal and the actual transects to allow correction for observer bias. The two 1-km transects are divided into 200m sections, making a total of ten 200m sections per square. Habitat information is recorded using codes from an established hierarchical system common to a range of BTO schemes (Crick 1992). Observers record the two primary habitat types for each transect section, in up to four levels of detail.
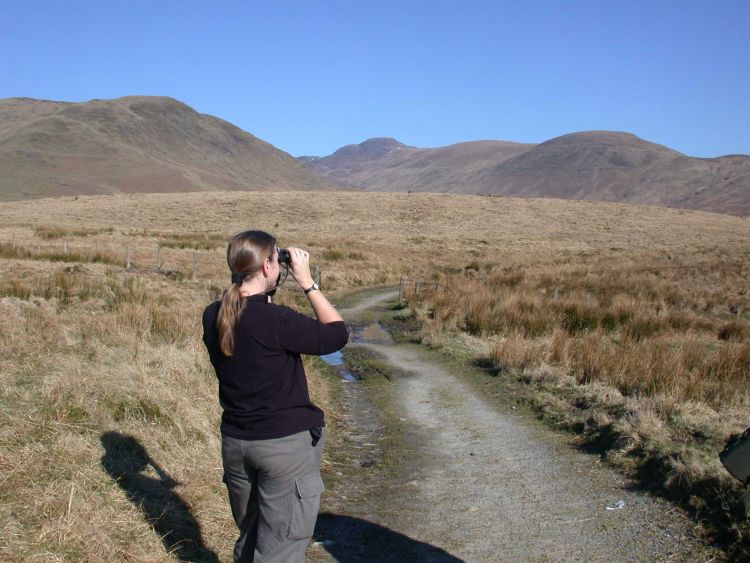
Bird counts are carried out on the second and third visits. Visits are timed so that the first is in the early part of the breeding season (April to mid-May) and the second at least four weeks later (mid-May to the end of June). Volunteers are asked to begin their counts in the early morning, so that they coincide with maximum bird activity, but avoid concentrated song activity at dawn. Volunteers record all the birds they see or hear as they walk methodically along their transect routes.
Birds are noted in four distance categories, three measured at right angles to the transect line (within 25m, between 25-100m, or over 100m from the transect line), and those seen in flight only. Recording birds in distance bands gives a measure of bird detectability and allows relative population density to be estimated.
The average visit time is around 90 minutes. Observers record the starting and finishing times for each of the two halves of the transect, and weather conditions, using a three-level weather code system to describe cloud cover, rain, wind and visibility. Observers are discouraged from conducting bird counts in heavy rain, poor visibility, or strong winds when activity is dampened.
In 2009, additional randomly selected 1-km squares surveyed as part of the Scottish Woodland BBS and the Upland BBS were added to the Scotland and England BBS data respectively. These squares were surveyed using the same methodology as standard BBS squares.
Mammal recording was introduced to the BBS in 1995 with a view to help improve our knowledge of the distribution and population trends of some of our commoner mammals. Compared with birds, the population trends of mammals are relatively poorly known. Even though mammal recording has always been a voluntary addition to the scheme, more than 80% of BBS observers now actively look for them during their bird-count visits.
Following four years of pilot studies, the Wider Countryside Butterfly Survey (WCBS) was formally launched in 2009. BBS volunteers can take part in the WCBS by making additional visits to their BBS squares to count butterflies.
Download the full BBS survey instructions here
Analytical methods
The total numbers of adult birds of each species detected in each 1-km square, i.e. summed over all distance categories and transect sections, are calculated for each year. The current BBS model takes the maximum of the two counts (early and late) as the annual measure of relative abundance. The maximum was chosen as a simple means of simultaneously reflecting the abundance of residents and early migrants, which tend to be most easily detected on the first visit, and later migrants, which tend to be most abundant in the second visit. Species not recorded in a particular survey year are assigned a count value of zero.
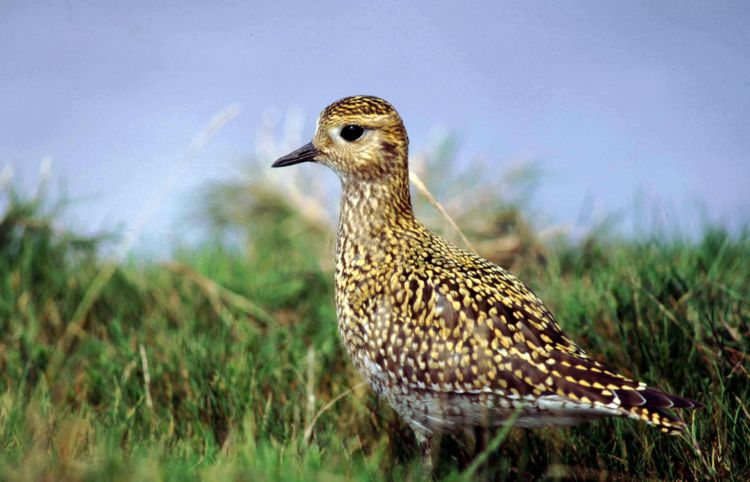
Field and Gregory (1999) investigated the possibility that trends for gulls, waterfowl and waders might be influenced by the presence of non-breeders, found that exclusion of counts greater than 5, 10 or 20 within single transect sections had no effect on trends for waterfowl or gulls. However, relatively large counts can influence trends in some waders, so totals of greater than ten for a single transect section are excluded in the current BBS model for six wader species (Oystercatcher, Lapwing, Curlew, Redshank, Snipe and Golden Plover). Golden Plover indices were additionally corrected to exclude all counts in non-upland habitat.
Annual population indices are calculated in SAS (SAS 1996) using a log-linear regression model with Poisson error terms. This is a modification of the computer program TRIM (Trends & Indices for Monitoring Data), for the analysis of time series of counts with missing observations (Pannekoek & van Strien 1996). We first modelled counts as a function of square (site) and year effects, with interpolated estimates for site-year combinations with missing data. The SAS GENMOD procedure uses the maximum likelihood method to fit the model and corrects for over-dispersion by using the ‘dscale’ option. Calculation of standard errors and test statistics differ from the standard maximum-likelihood method, because of the need to take into account over-dispersion and serial correlation. While these usually have only a small effect on the estimates of parameters, they can have important effects on standard errors.
The change in species populations, estimated by comparison between the start and end years in the series, do not take into account population fluctuations that may have occurred in the intervening years. For this reason, a second model that fits linear trends was used to examine the significance of the underlying trends. Like other monitoring projects that involve the annual surveying of a large number of sites, the BBS data includes many missing values, where a particular site was not monitored. The model is estimated using the observed counts and then used to predict the missing counts and calculate the indices from a full data set, including observed and predicted counts. The model requires two points in the time series to estimate parameters, and hence squares counted in only one year are excluded. Moreover, if the data are too sparse, i.e. contain too many missing values, the model parameters cannot be estimated.
Because the stratified sampling design results in unequal representation of regions across the UK, annual counts are weighted by the inverse of the proportion of the area of each region that is surveyed that year. All trends are calculated across habitats.
Before the 2008 BBS report, BBS annual reports presented unsmoothed population trends. We now have a sufficiently long run of data to calculate smoothed trends for population changes since the start of the survey in 1994, and these smoothed trends are presented in BBS annual reports since 2008. The unsmoothed trend between the two most recent years is also shown.
Go to the most recent BBS population trends.
References
Crick, H.Q.P. (1992) A bird-habitat coding system for use in Britain and Ireland incorporating aspects of land management and human activity. Bird Study 39: 1-12.
Field, R.H. & Gregory, R.D. (1999) Measuring population changes from the Breeding Bird Survey. Research Report No. 217, British Trust for Ornithology, Thetford.
Pannekoek, J. & van Strien, A.J. (1996) TRIM – Trends & Indices for Monitoring Data. Research Paper No. 9634, Statistics Netherlands, Voorburg.
SAS. Institute Inc. (1996) SAS/Stat Software: Changes and Enhancements through Release 6.11. SAS Institute, Inc., Cary, North Carolina.








Share this page